



CROSSTABS: Click Here
1. Party Identification
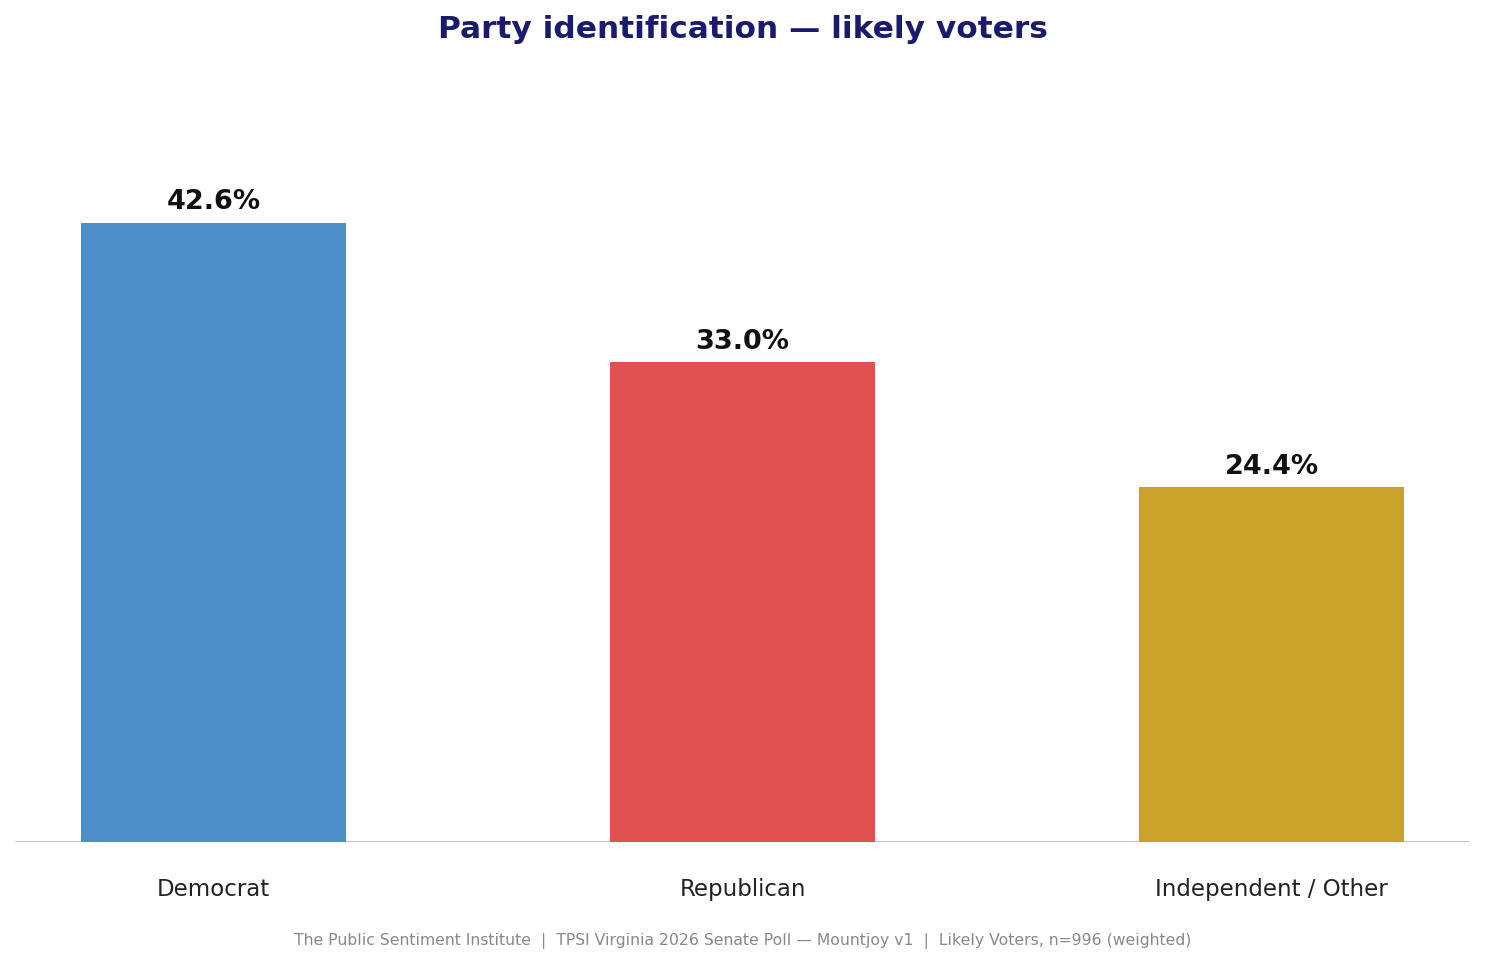
Democrats 43% · Republicans 33% · Independents/Other 24%
The party ID split is essentially unchanged from May (40.9 / 35.0 / 24.1). Democrats hold a durable ~10-point registration edge among likely voters, the structural baseline that drives every other number in this poll.
2. August 4th Republican Senate Primary
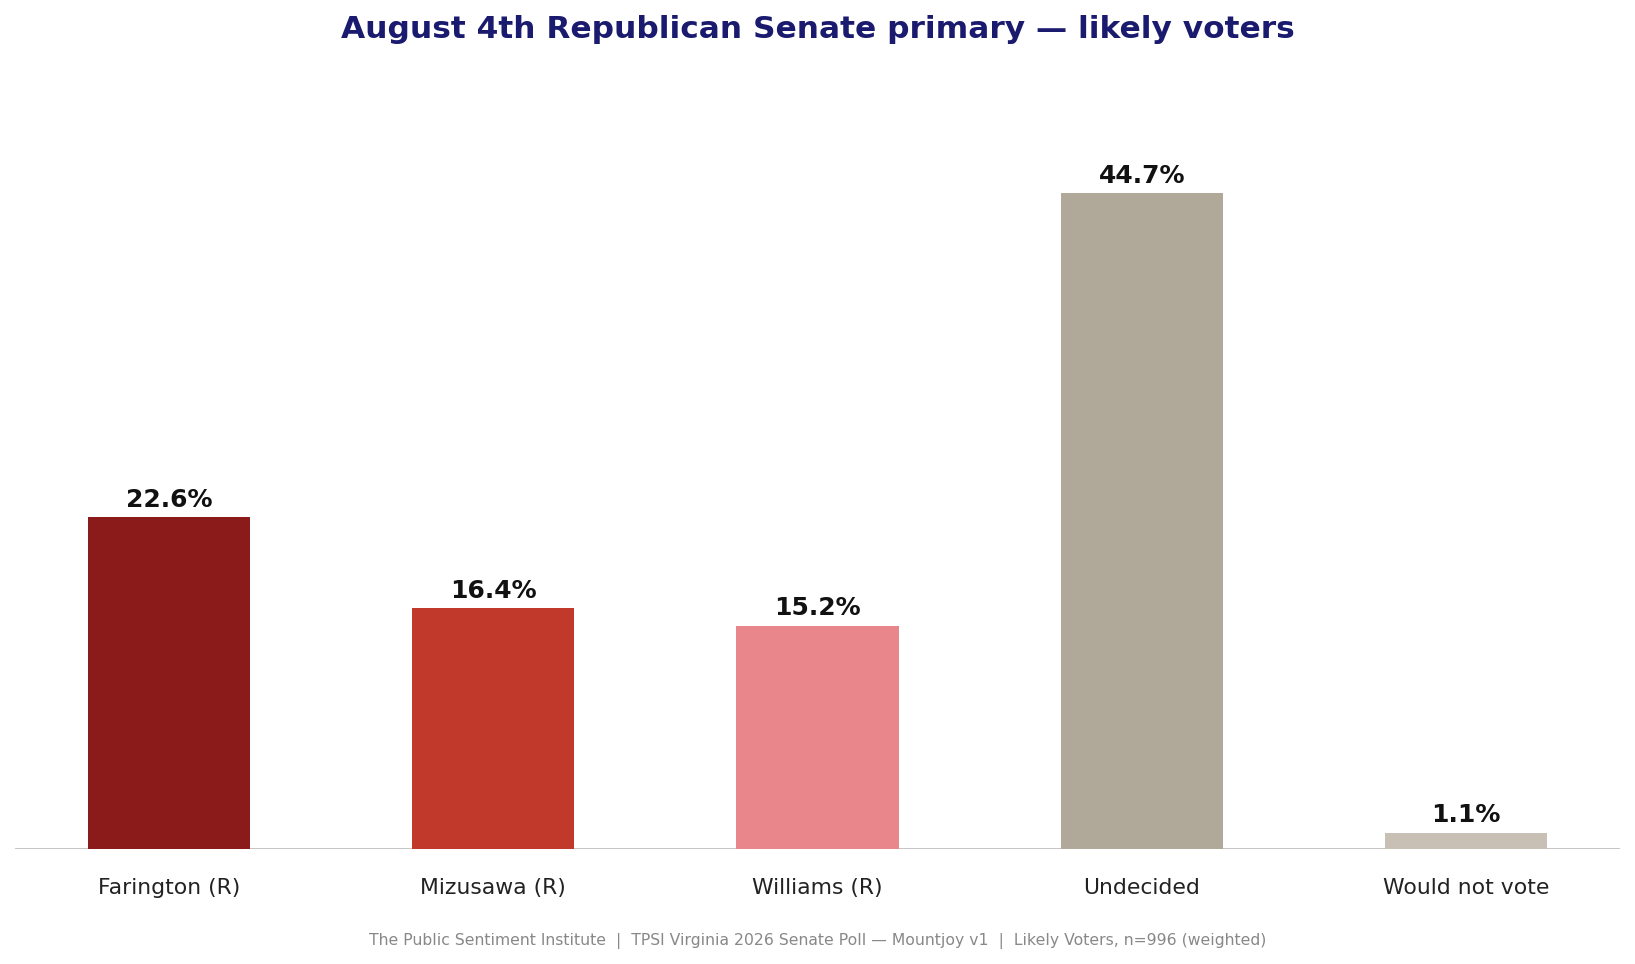
Farington 22.6% · Mizusawa 16.4% · Williams 15.2% · Undecided 44.7%
The primary order reshuffled since May. Farington holds her lead (up slightly from 22.3%), but Mizusawa dropped significantly from 23.5% to 16.4%, while Williams climbed from 10.1% to 15.2%. The most important number remains the same: 44.7% undecided. This race has not been decided, it hasn’t really started. The August 4th primary is the first real inflection point.
3. 2026 Midterm Generic Ballot
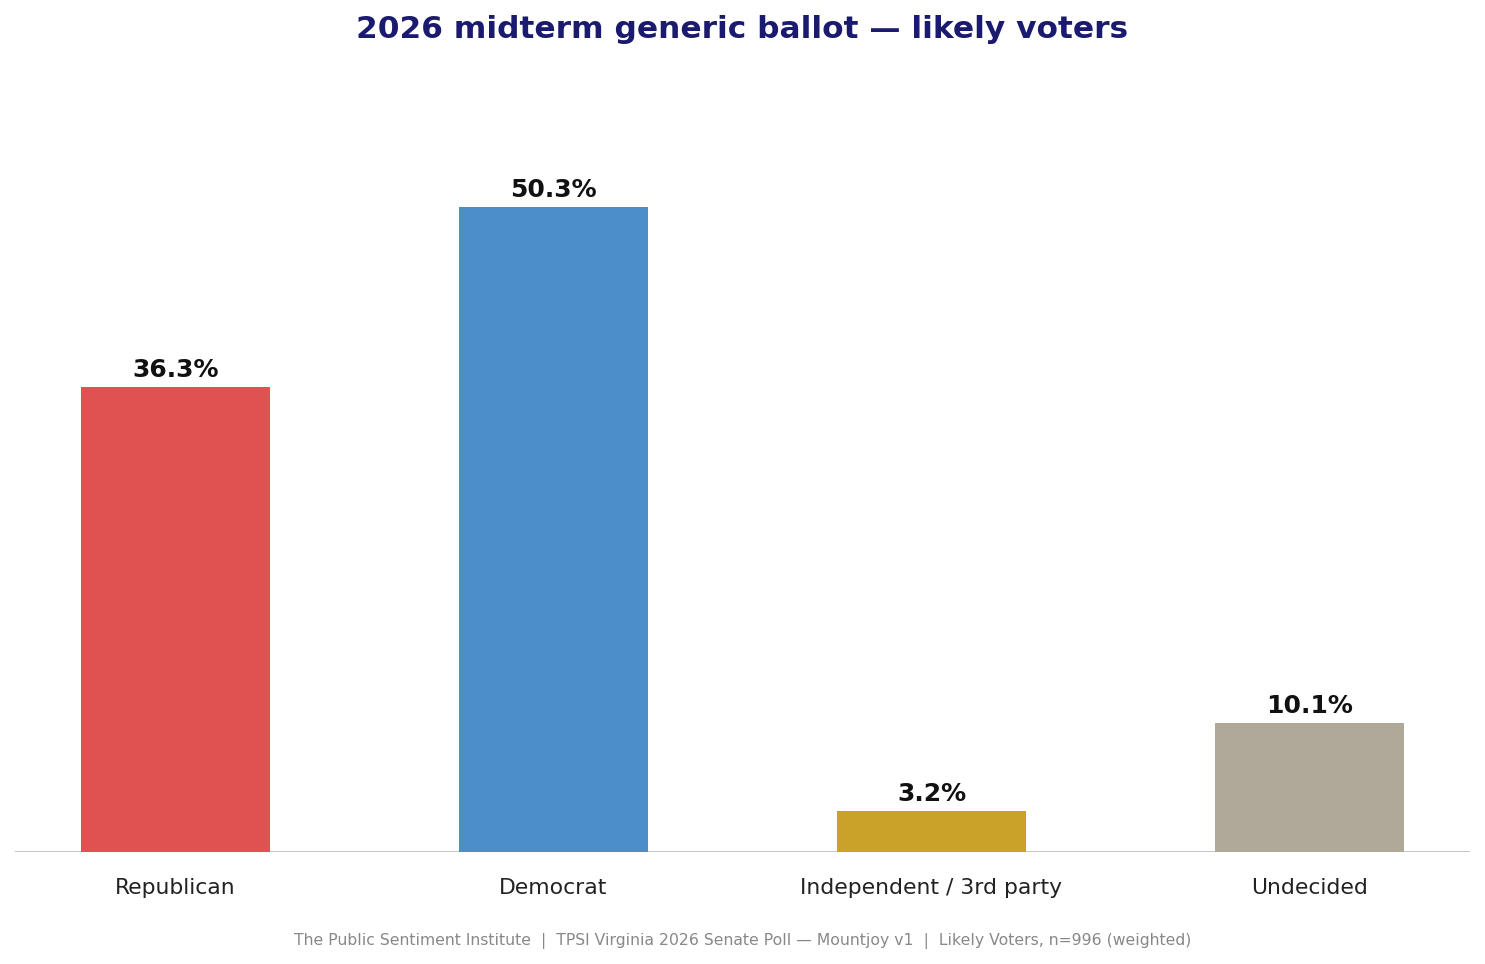
Democrats 50% · Republicans 36% · Independent/3rd Party 3% · Undecided 10%
Democrats lead by 14 points, consistent with May’s D+14. Democrats are right at the 50% threshold, meaning a Republican sweep of undecideds could, in theory, close the gap, though it would require near-total consolidation against a macro environment that currently disfavors Republicans.
4–6. Senate General Election Matchups
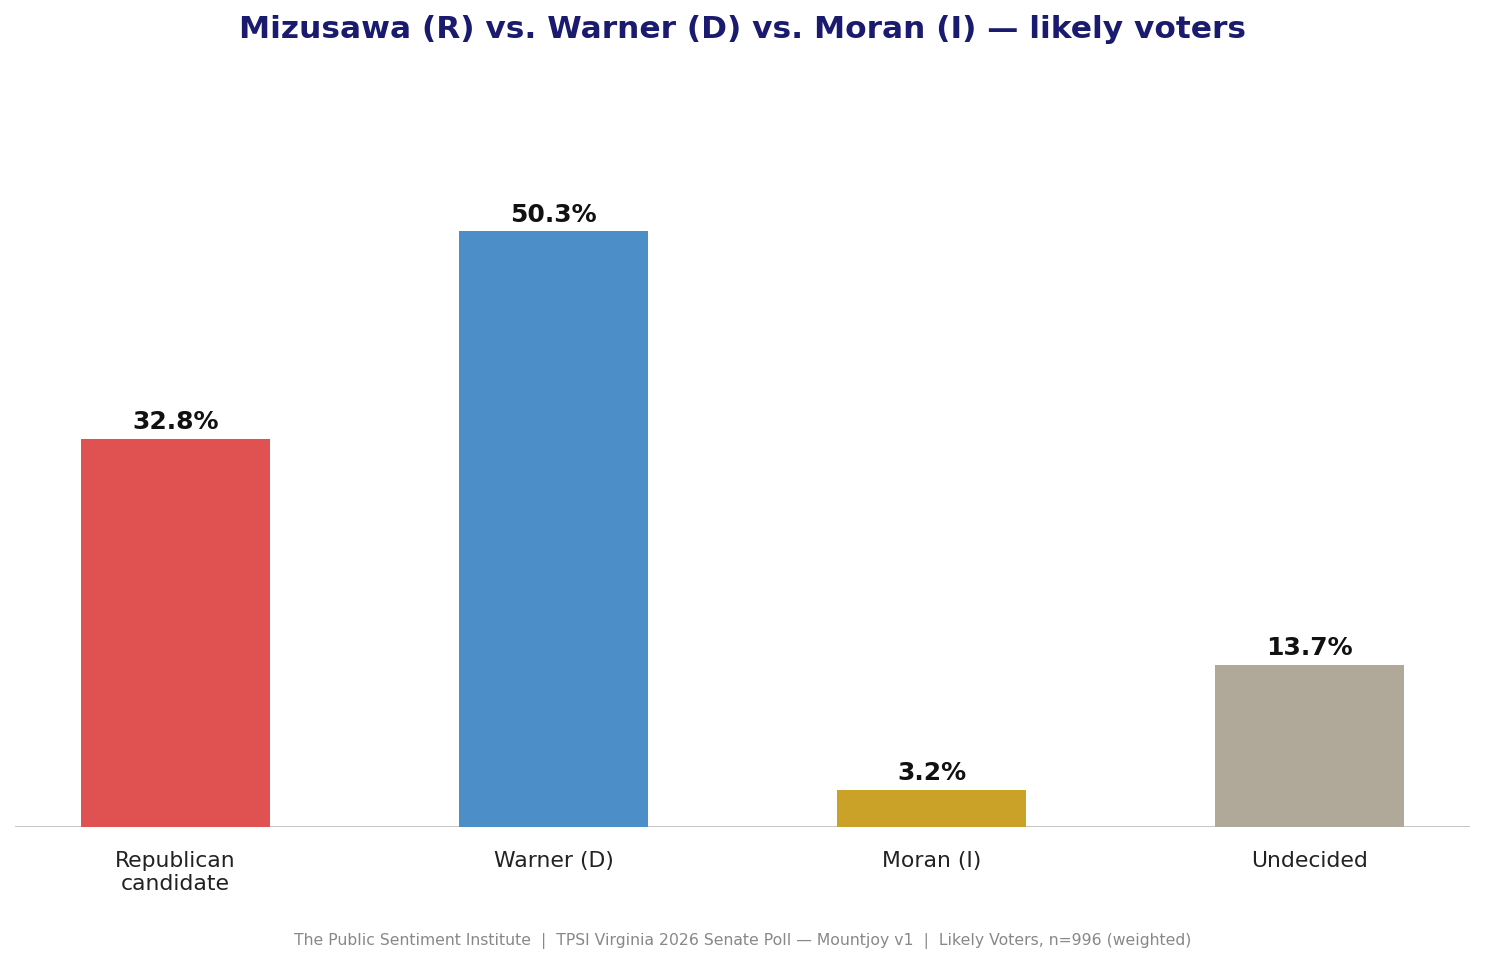
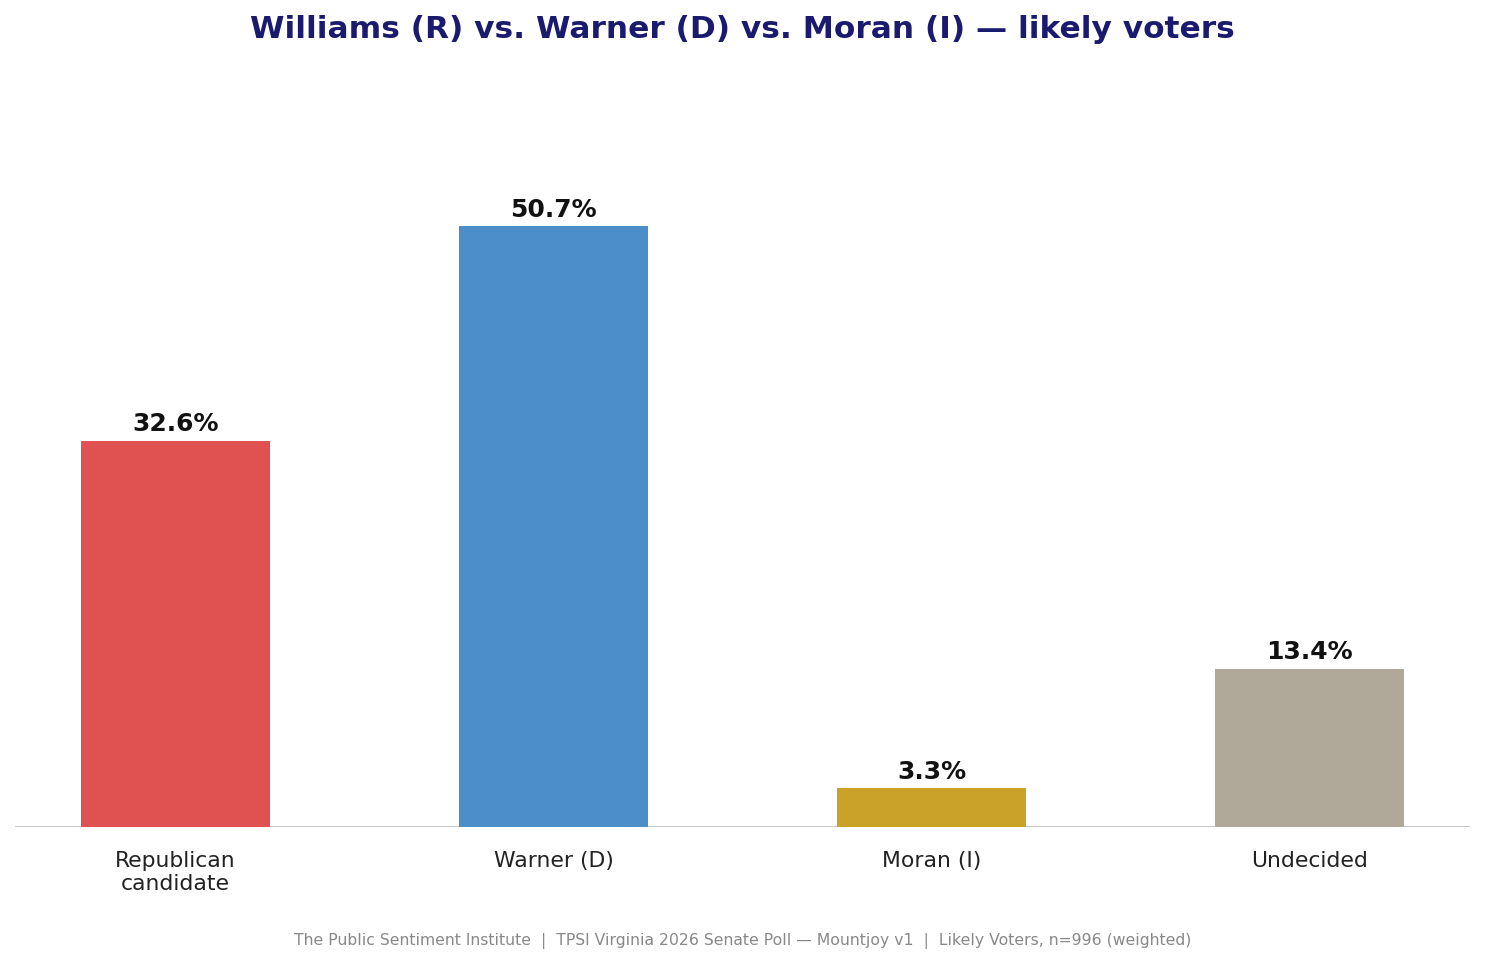
Warner (D) leads all three Republican challengers by ~18 points
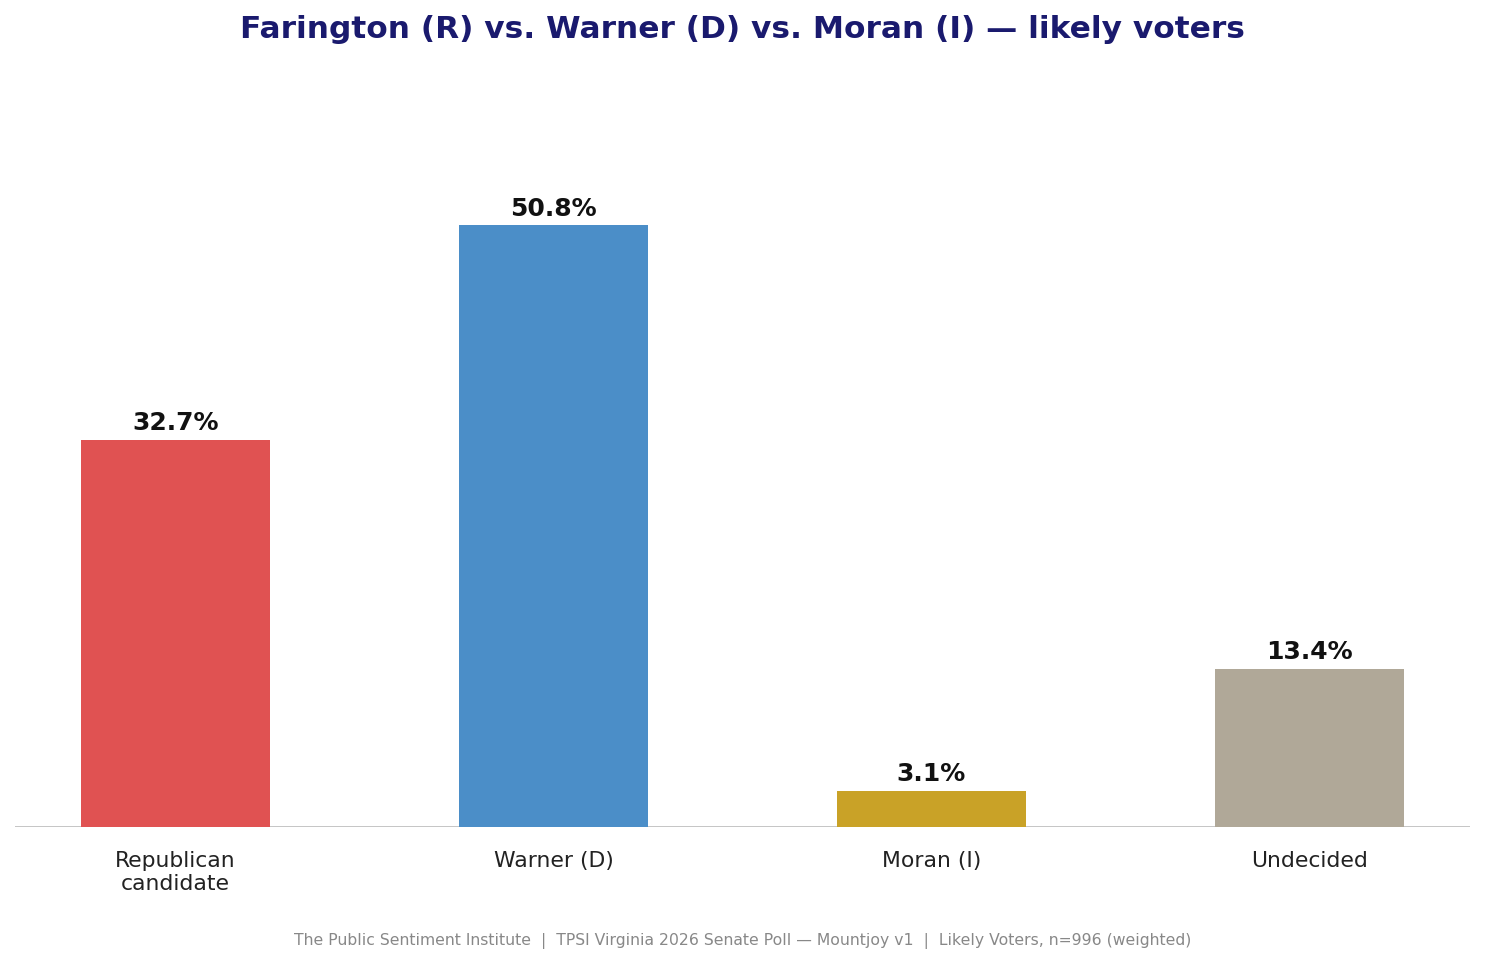
vs. Farington: Warner 50.8%, Farington 32.7%
vs. Mizusawa: Warner 50.3%, Mizusawa 32.8%
vs. Williams: Warner 50.7%, Williams 32.6%
The consistency is the story. All three Republicans land within half a point of each other despite very different backgrounds, confirming that the GOP number reflects the state’s partisan environment, not individual candidate quality. These are floors, not ceilings. Post-primary consolidation will raise the Republican number, but from an ~18-point deficit, not a competitive starting point.
7. Trump Job Approval
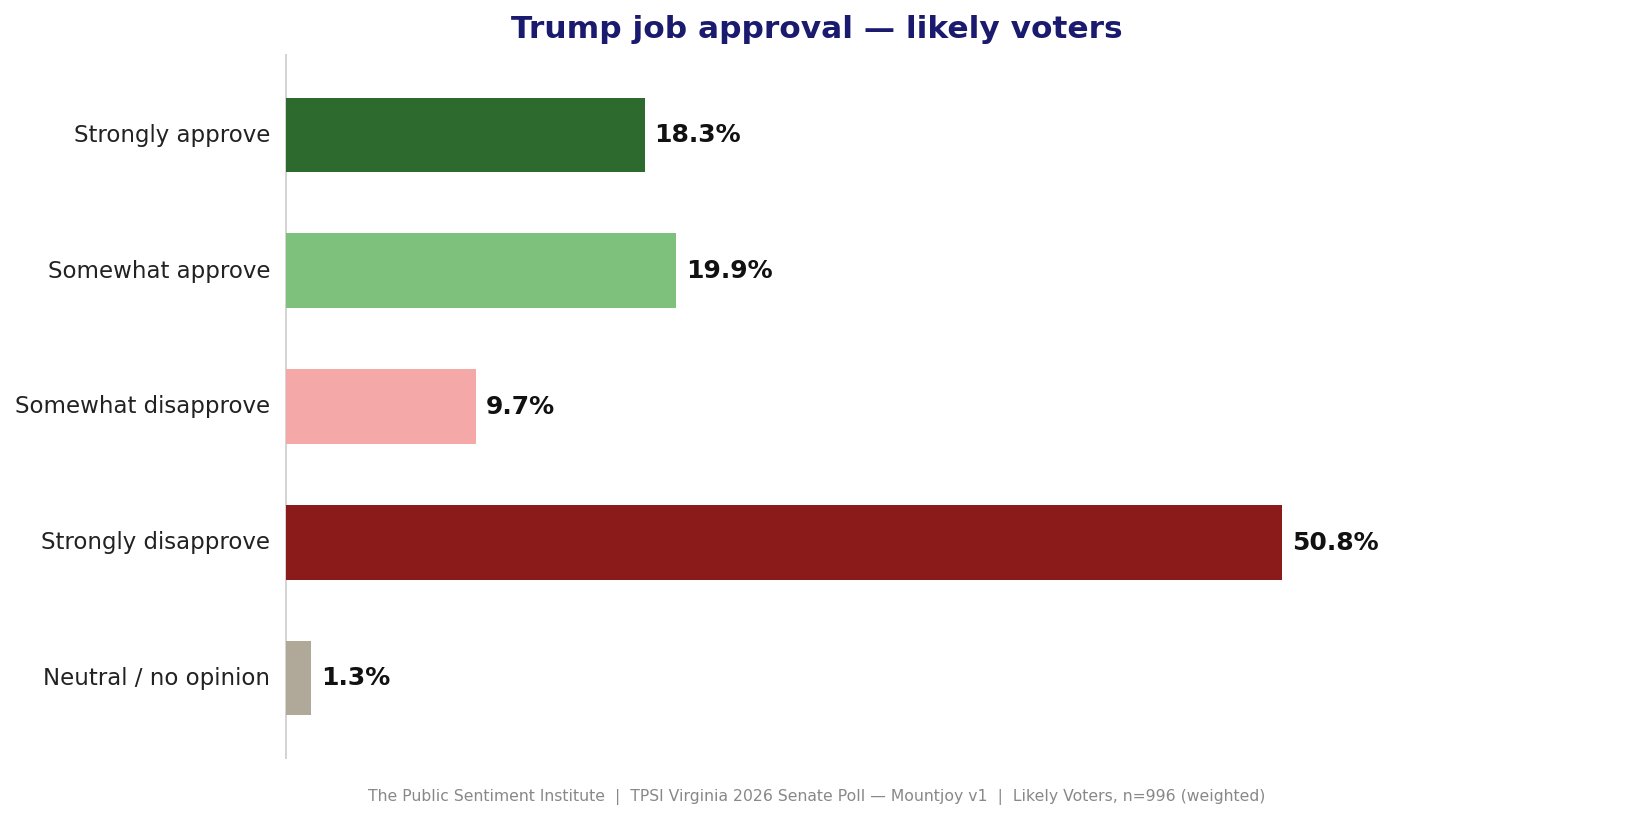
Approve 38.2% · Disapprove 60.5% · Strongly Disapprove 50.8%
Trump is deeply underwater, and his disapproval is intensifying. Strong disapproval rose from 49.3% in May to 50.8% now. The intensity gap is nearly 3-to-1: strong disapprovers (50.8%) vs. strong approvers (18.3%). That asymmetry matters for turnout, motivated disapprovers show up.
8. Spanberger Approval
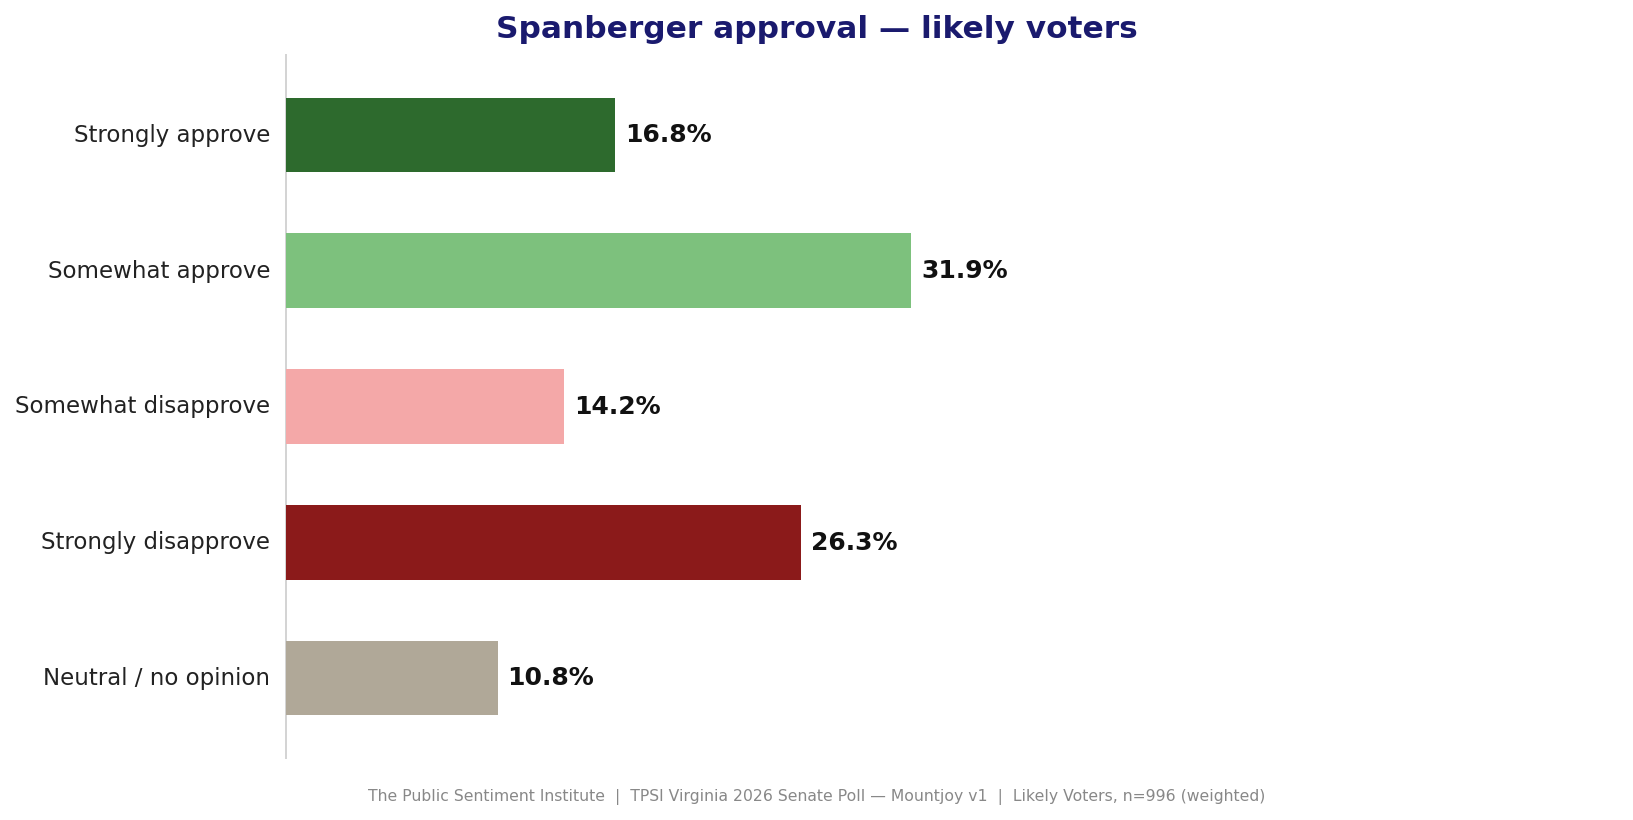
Approve 48.8% (Strongly 16.8% / Somewhat 31.9%) · Disapprove 40.5% (Strongly 26.3% / Somewhat 14.2%)
Spanberger remains net positive at +8.3 points, but her numbers softened slightly from May’s 52.0% / 40.7% (net +11.3). The intensity split is worth watching: strong disapprovers (26.3%) outnumber strong approvers (16.8%). She is still in solid territory for a first-term governor, but the direction of the intensity trend is something to monitor.
9. 2024 Presidential Vote Recall
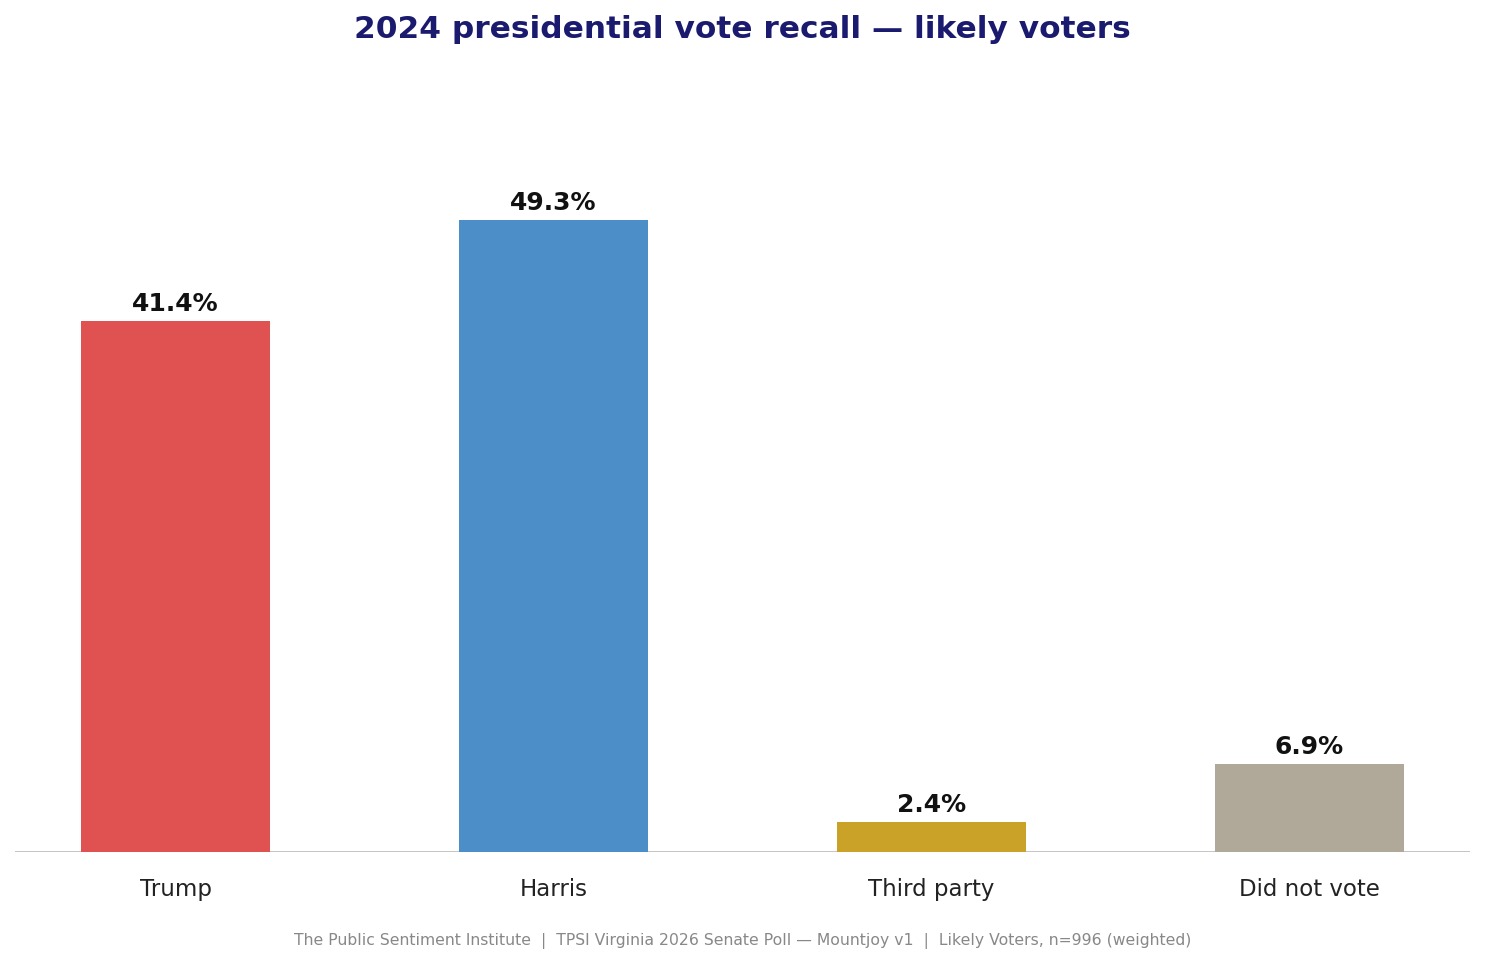
Harris 49.3% · Trump 41.4% · Third Party 2.4% · Did Not Vote 6.9%
The recall distribution confirms this is a legitimately Democratic-leaning likely voter universe, broadly consistent with Virginia’s actual 2024 presidential result (Harris won the state). The sample is internally valid.
10. General Political Outlook / Ideological Typology
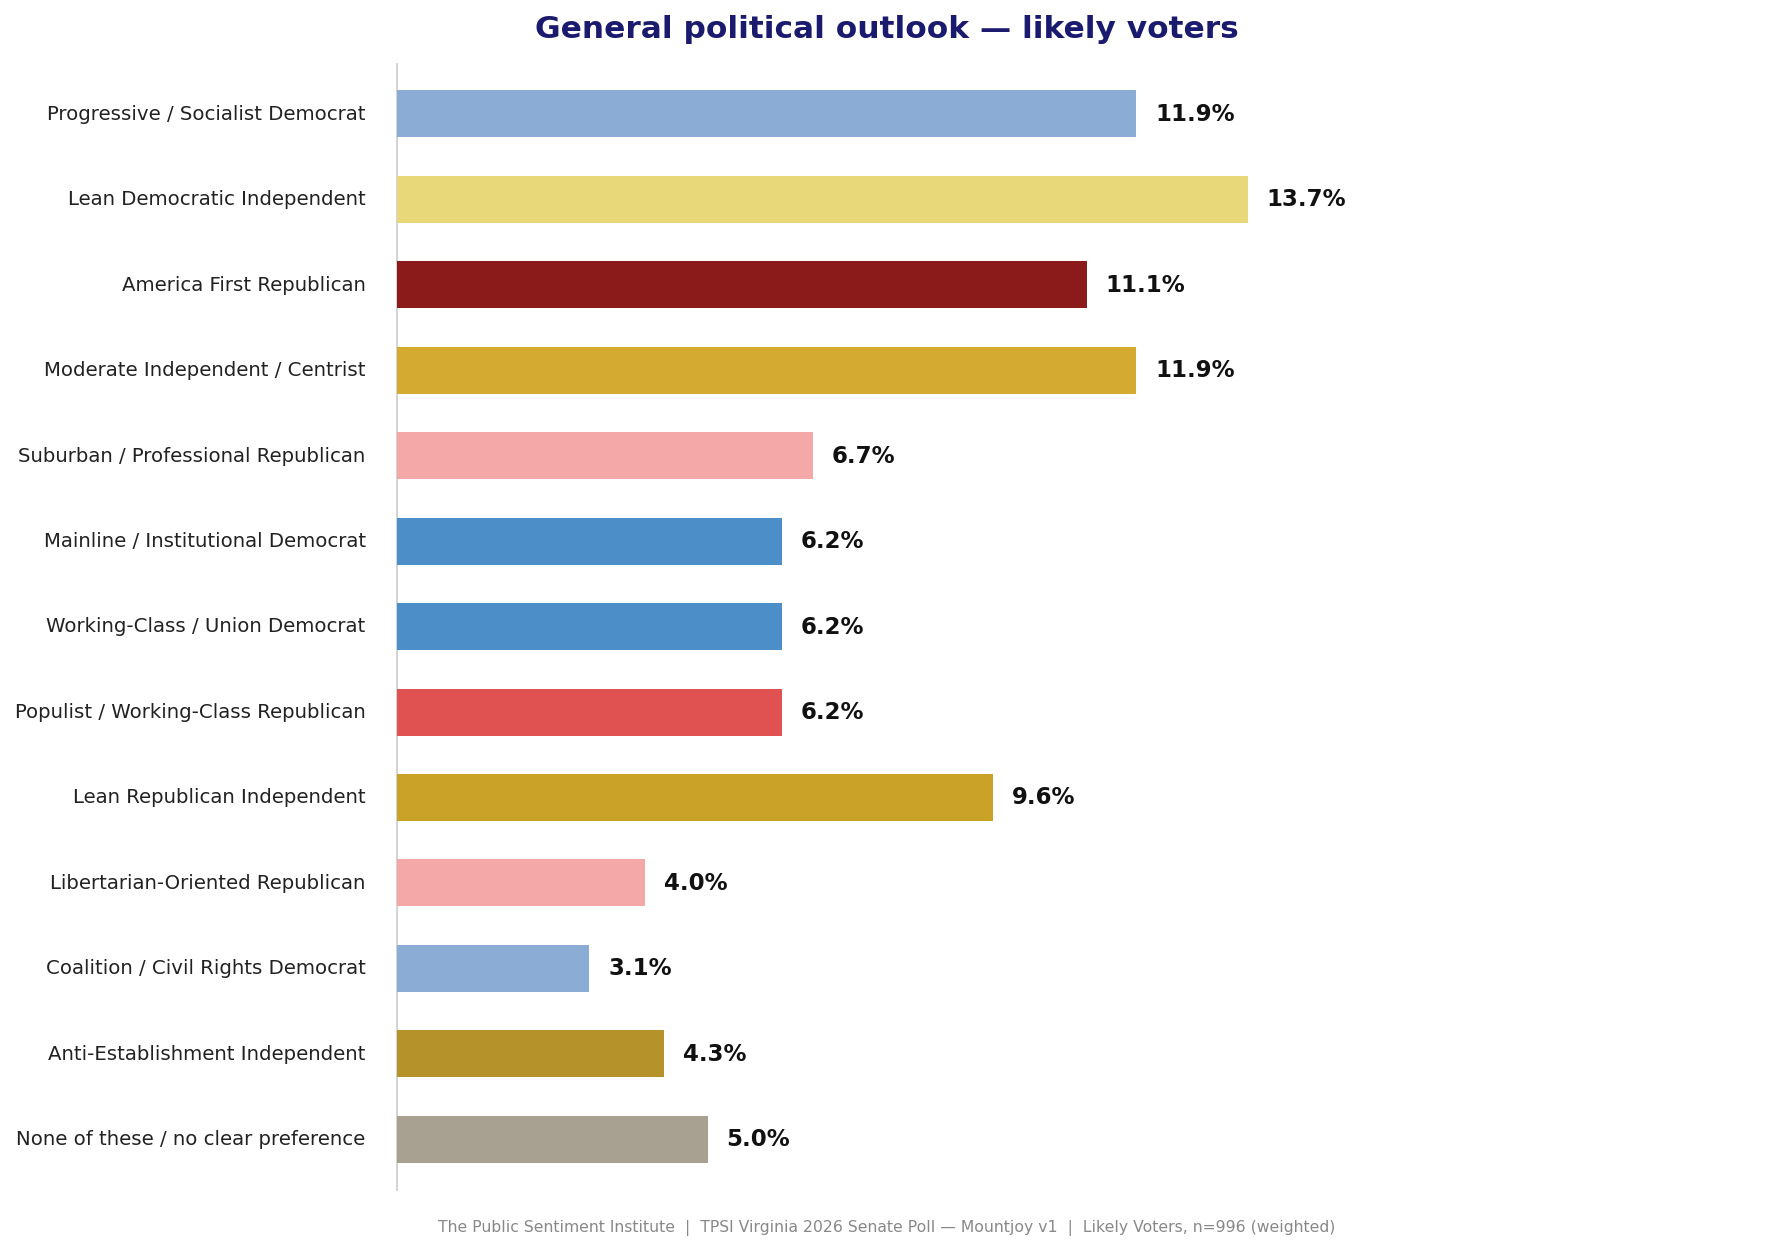
The electorate is fragmented across 13 self-identified ideological types. The largest groups: Lean Democratic Independent (13.7%), Progressive/Socialist Democrat (11.9%), America First Republican (11.1%), and Moderate Independent/Centrist (11.9%). The Republican base is split between America First (11.1%), Suburban/Professional (6.7%), Populist/Working-Class (6.2%), and Libertarian-Oriented (4.0%) factions. Democrats have a more cohesive ideological coalition heading into 2026.
11. Mass Deportation Support/Opposition
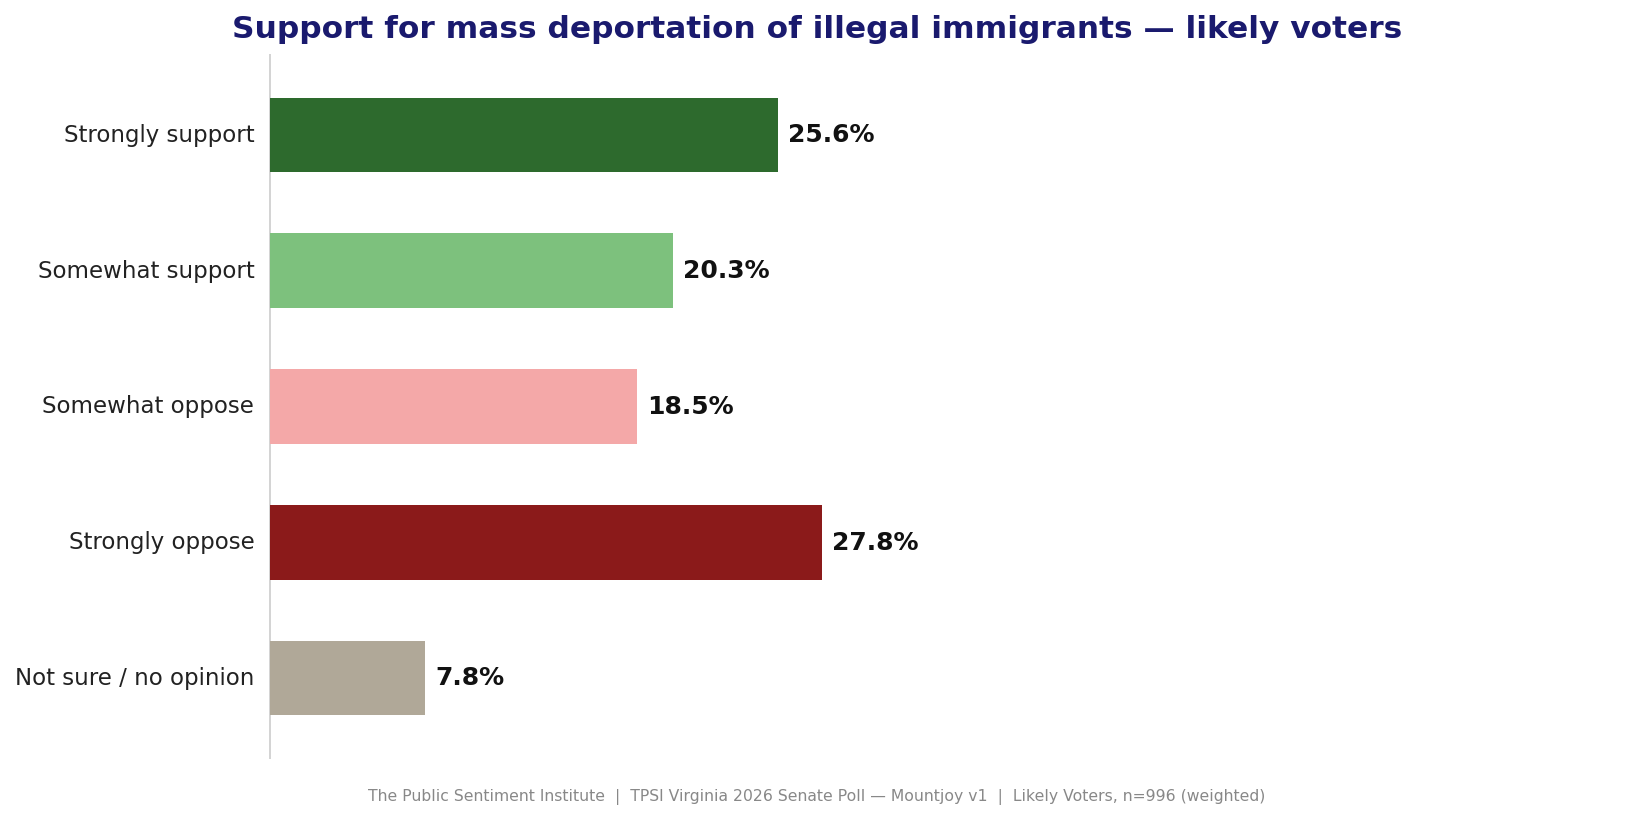
Support 45.9% (Strongly 25.6% / Somewhat 20.3%) · Oppose 46.3% (Strongly 27.8% / Somewhat 18.5%)
Virginia likely voters are essentially split on mass deportation, but the intensity favors opponents: 27.8% strongly oppose vs. 25.6% strongly support. This is consistent with May’s finding that Republicans hold an advantage on immigration messaging, but that advantage is narrower than national polls suggest and does not extend to majority support for the most aggressive enforcement measures.
12. Pro-Israel PAC Donations
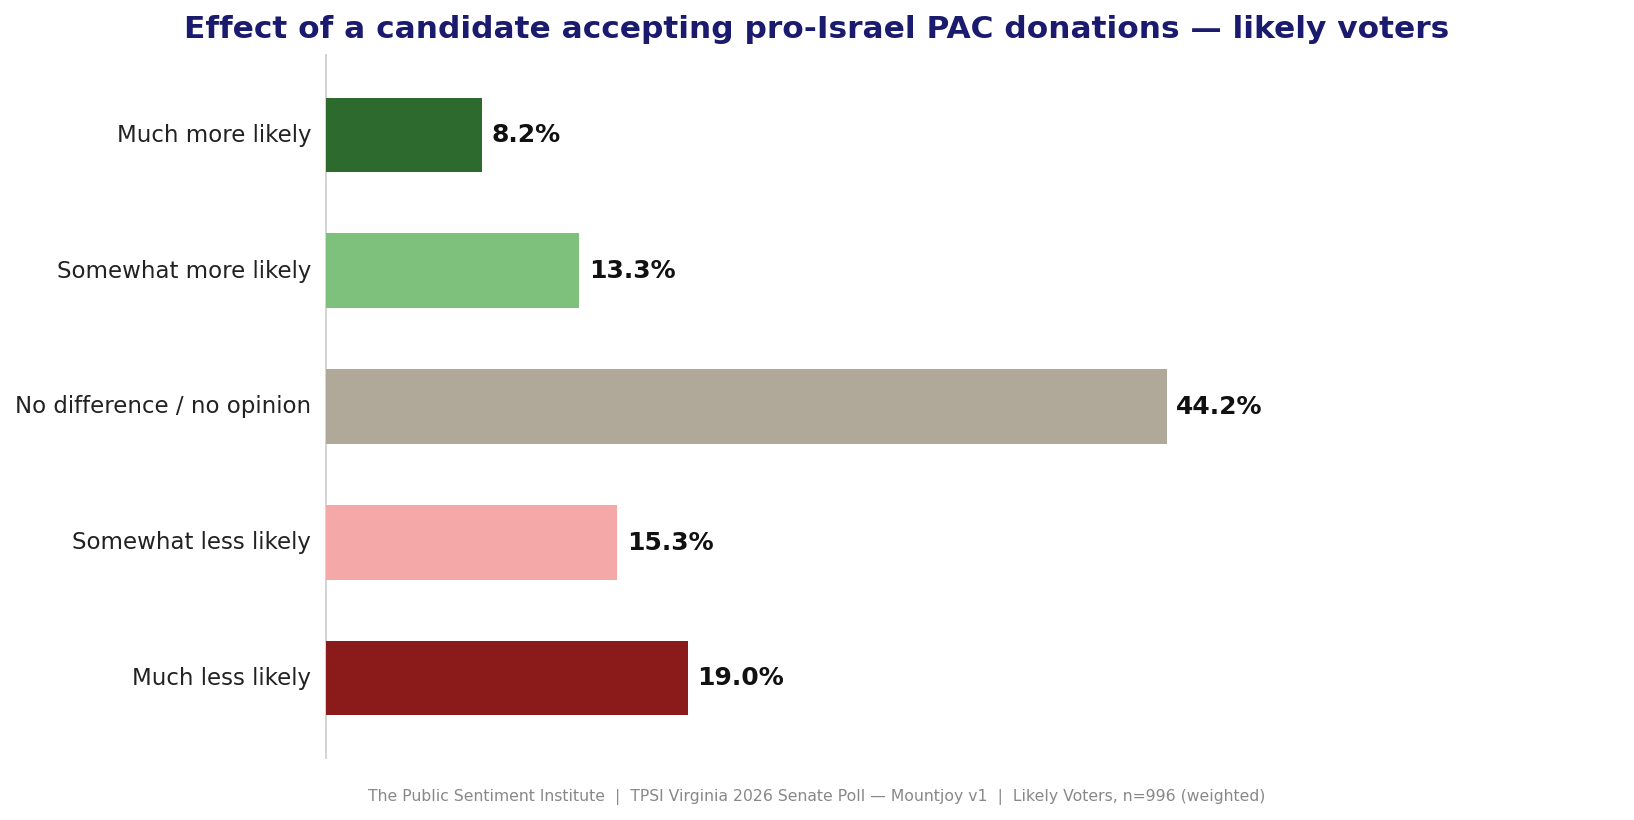
Much More Likely 8.2% · Somewhat More Likely 13.3% · No Difference 44.2% · Somewhat Less Likely 15.3% · Much Less Likely 19.0%
Net: -12.9 among likely voters. The largest group (44.2%) says it makes no difference, but the negative signal is real — 34.3% say they’d be less likely to support a candidate accepting pro-Israel PAC money vs. 21.4% who’d be more likely. The negative sentiment is concentrated among progressive Democrats and independents.
13. Difficulty Paying Household Expenses
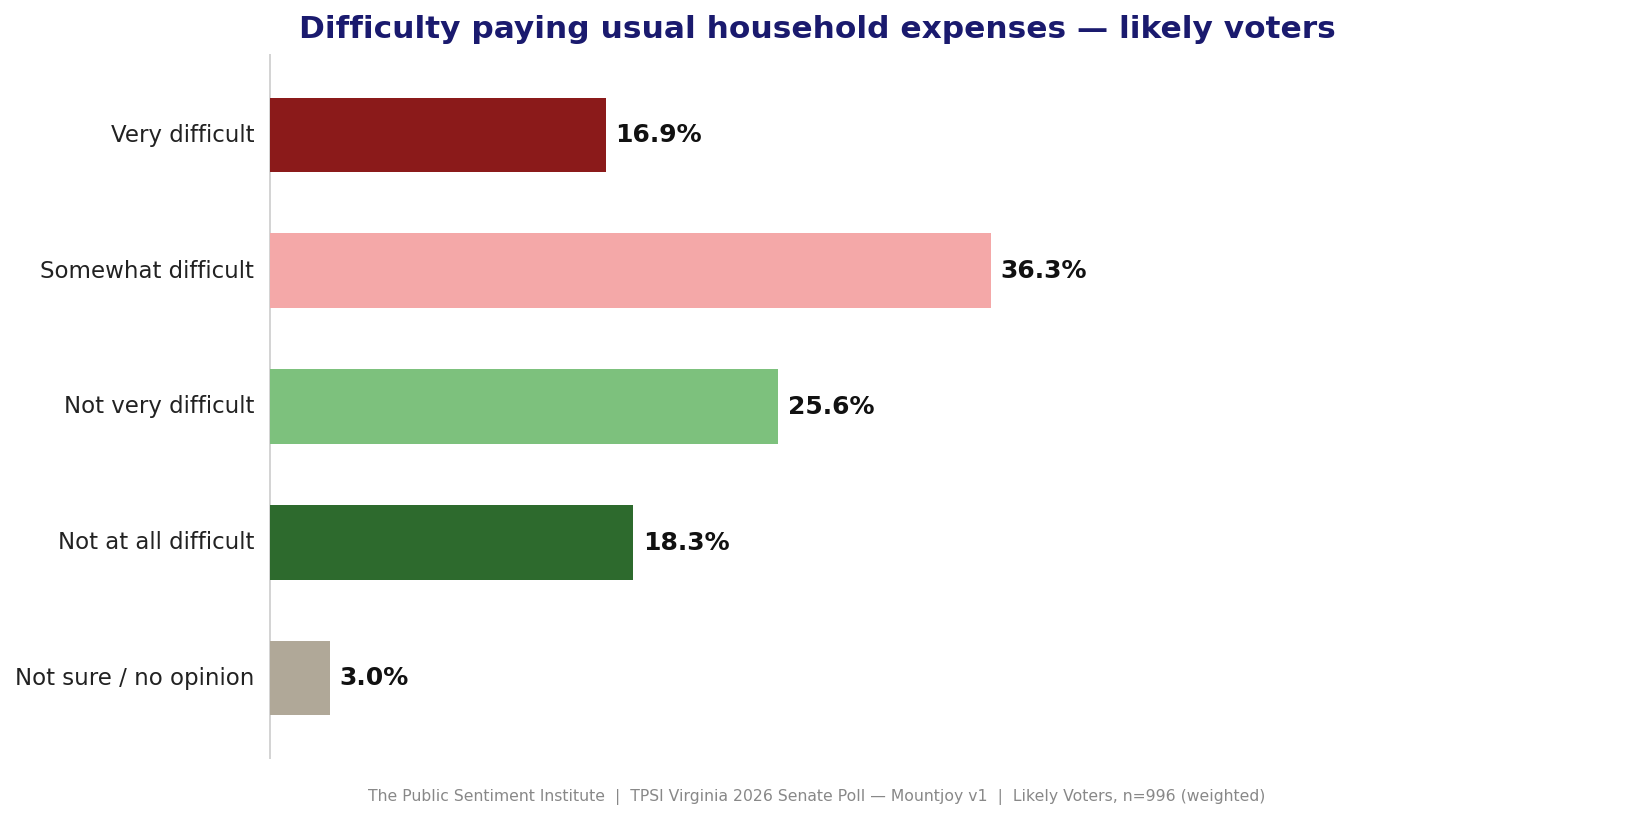
Very Difficult 16.9% · Somewhat Difficult 36.3% · Not Very Difficult 25.6% · Not At All Difficult 18.3%
53.2% of likely voters report at least some difficulty paying usual household expenses. This is the economic backdrop for the entire 2026 cycle. The economy ranks #1 as a voting issue by a wide margin, and more than half the electorate is feeling financial strain — a standing indictment of the current economic environment regardless of which party voters blame.
14. Perceived Balance of Trump’s Actions
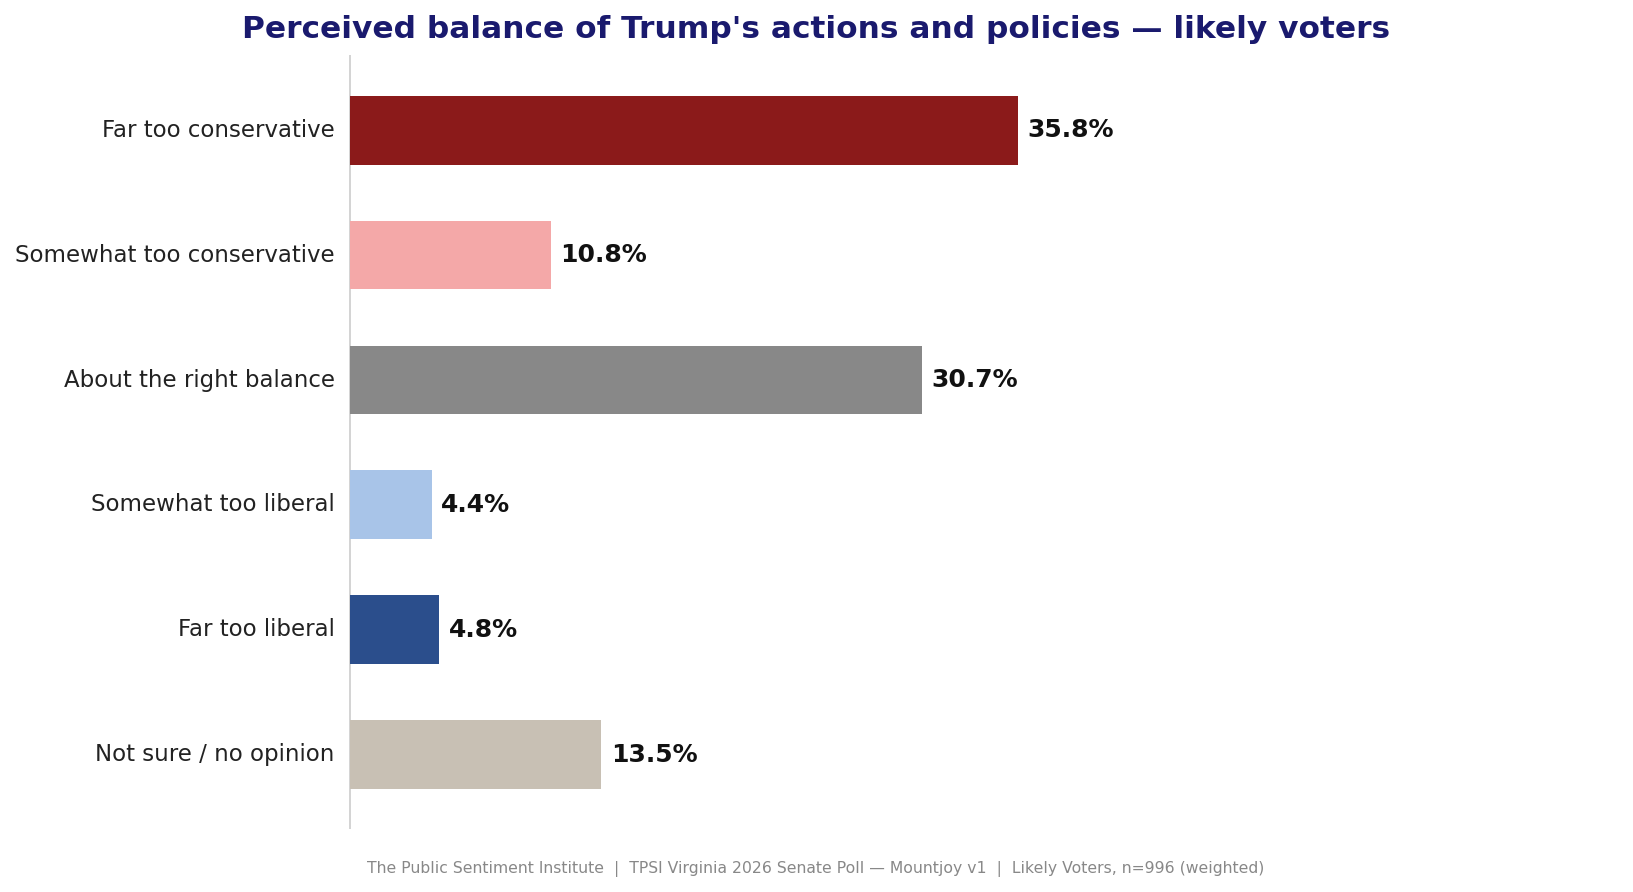
Far Too Conservative 35.8% · Somewhat Too Conservative 10.8% · About Right 30.7% · Too Liberal (combined) 9.2%
Nearly half of likely voters (46.6%) consider Trump’s agenda too conservative. Just 30.7% think he’s striking the right balance. Only 9.2% think he’s too liberal — essentially the libertarian and anti-DOGE right. This question captures the core problem for Republicans in Virginia: the Trump brand is misaligned with the state’s ideological center.
15. Voting Intention and Motivation
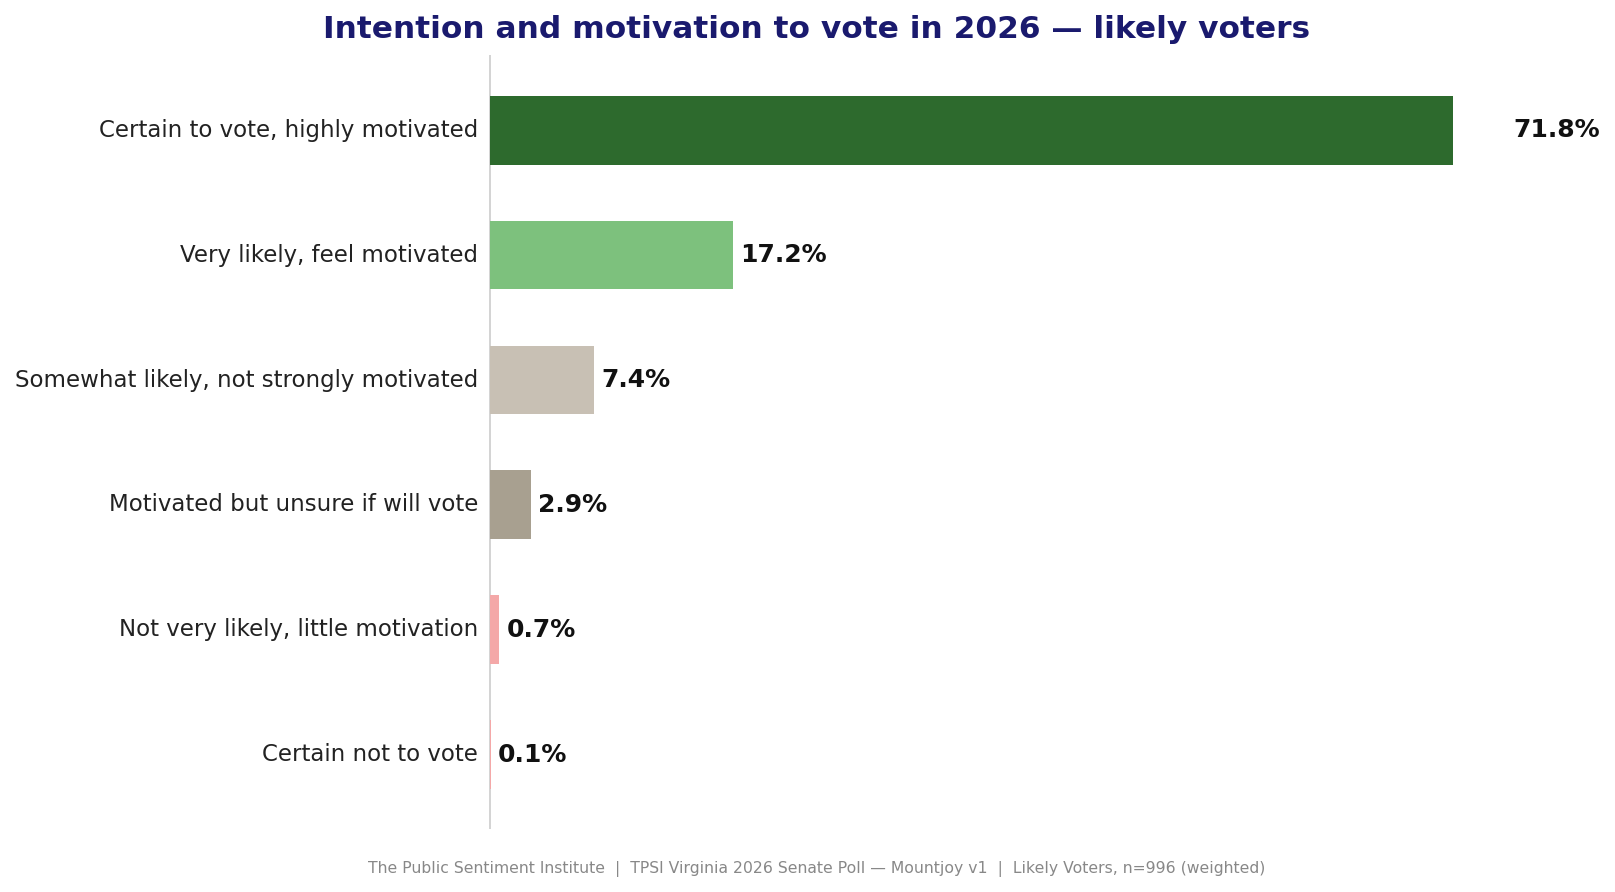
Certain to Vote, Highly Motivated 71.8% · Very Likely, Feel Motivated 17.2%
A strong 89.0% of likely voters express high confidence they will vote and feel motivated to do so. This is partly a function of how the likely voter screen was constructed, but it also reflects genuine engagement on both sides. There is no enthusiasm gap visible in this data — both Democratic and Republican voters are fired up heading into 2026.
16. Whose Interests Trump’s Foreign Policy Serves
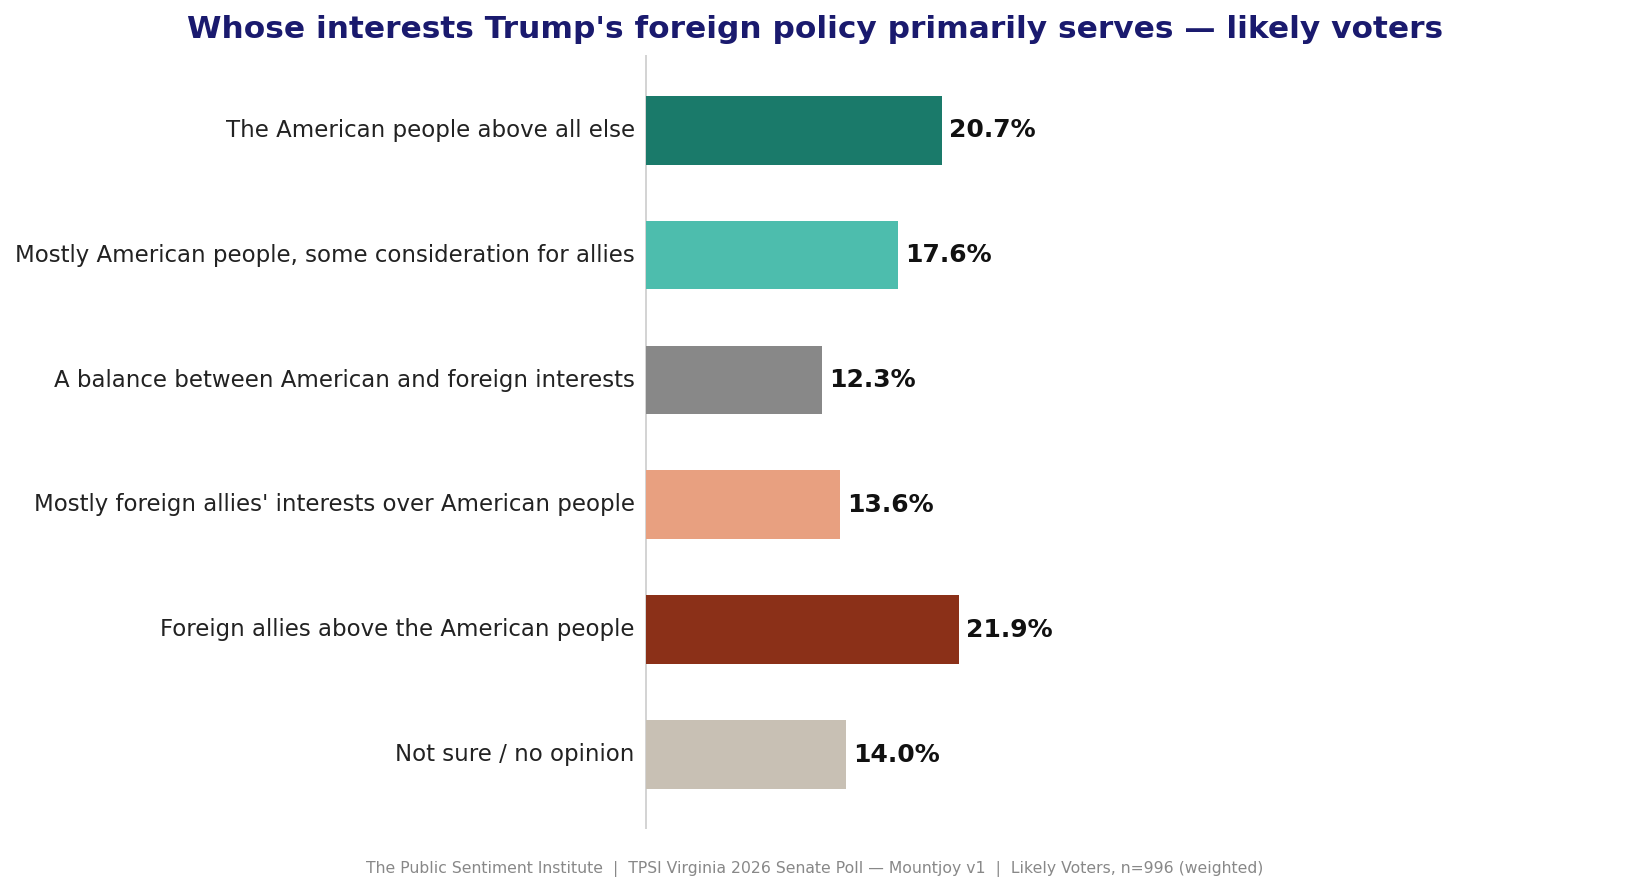
American people above all 20.7% · Mostly American 17.6% · Balance 12.3% · Mostly foreign allies 13.6% · Foreign allies above American people 21.9% · Not sure 14.0%
A plurality of likely voters (21.9%) believe Trump’s foreign policy serves foreign allies’ interests above those of American citizens — the single largest response category. Combined with “mostly foreign allies” (13.6%), 35.5% hold a skeptical or negative view of Trump’s foreign policy orientation. Only 38.3% see it as primarily serving American interests. This is a significant vulnerability, especially given that Virginia’s likely voter universe includes a high concentration of national security and federal government professionals.
17. Top Voting Issue (#1 Rankings)
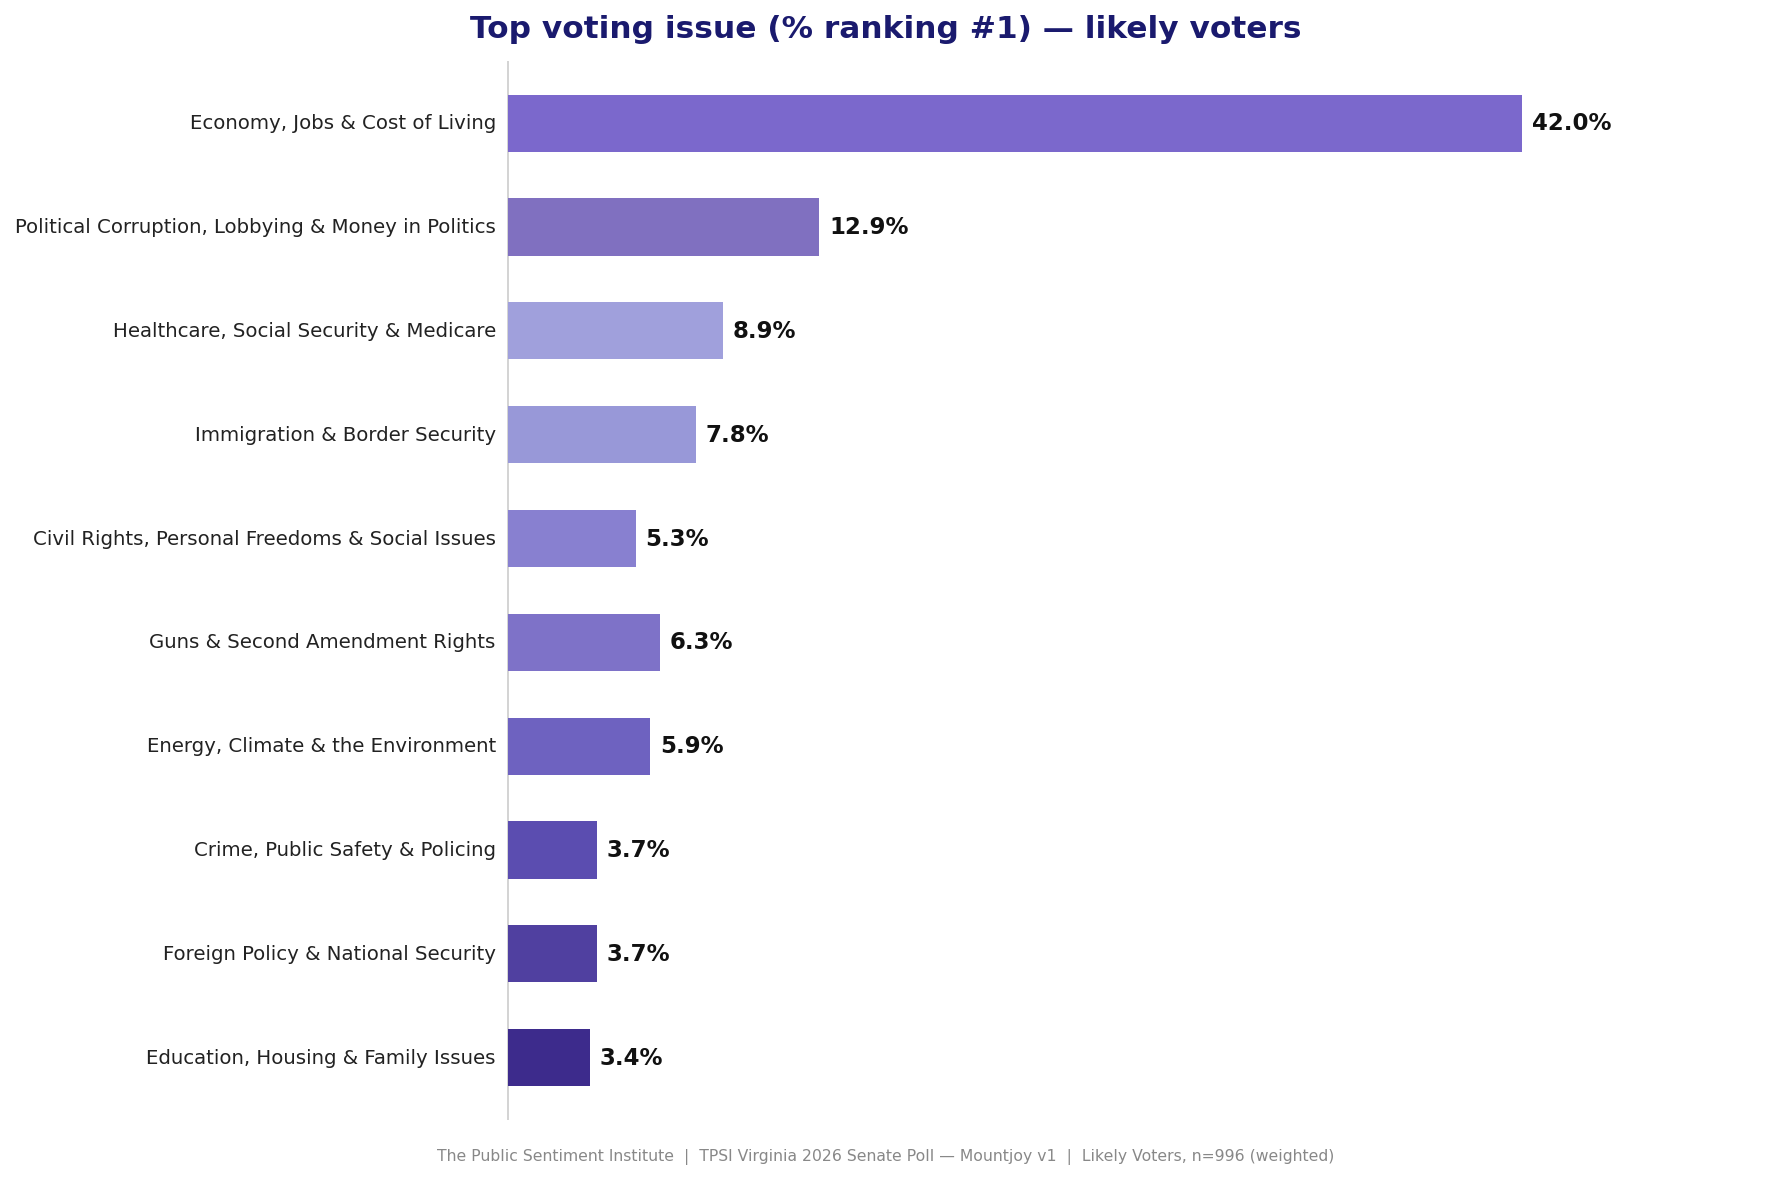
Economy, Jobs & Cost of Living 42.0% · Political Corruption 12.9% · Immigration 7.8% · Healthcare/Social Security 8.9%
The economy dominates by a 3-to-1 margin over the next closest issue. Political corruption ranks second at 12.9% — a notably high figure that reflects an activated anti-corruption segment cutting across party lines. Immigration ranks 6th at 7.8%, consistent with May’s finding that immigration is a Republican advantage issue but not the primary driver of Virginia’s 2026 electorate. The issue landscape still favors Democrats on trust, but the economic distress numbers keep the door cracked for any Republican who can credibly own a working-class economic message.
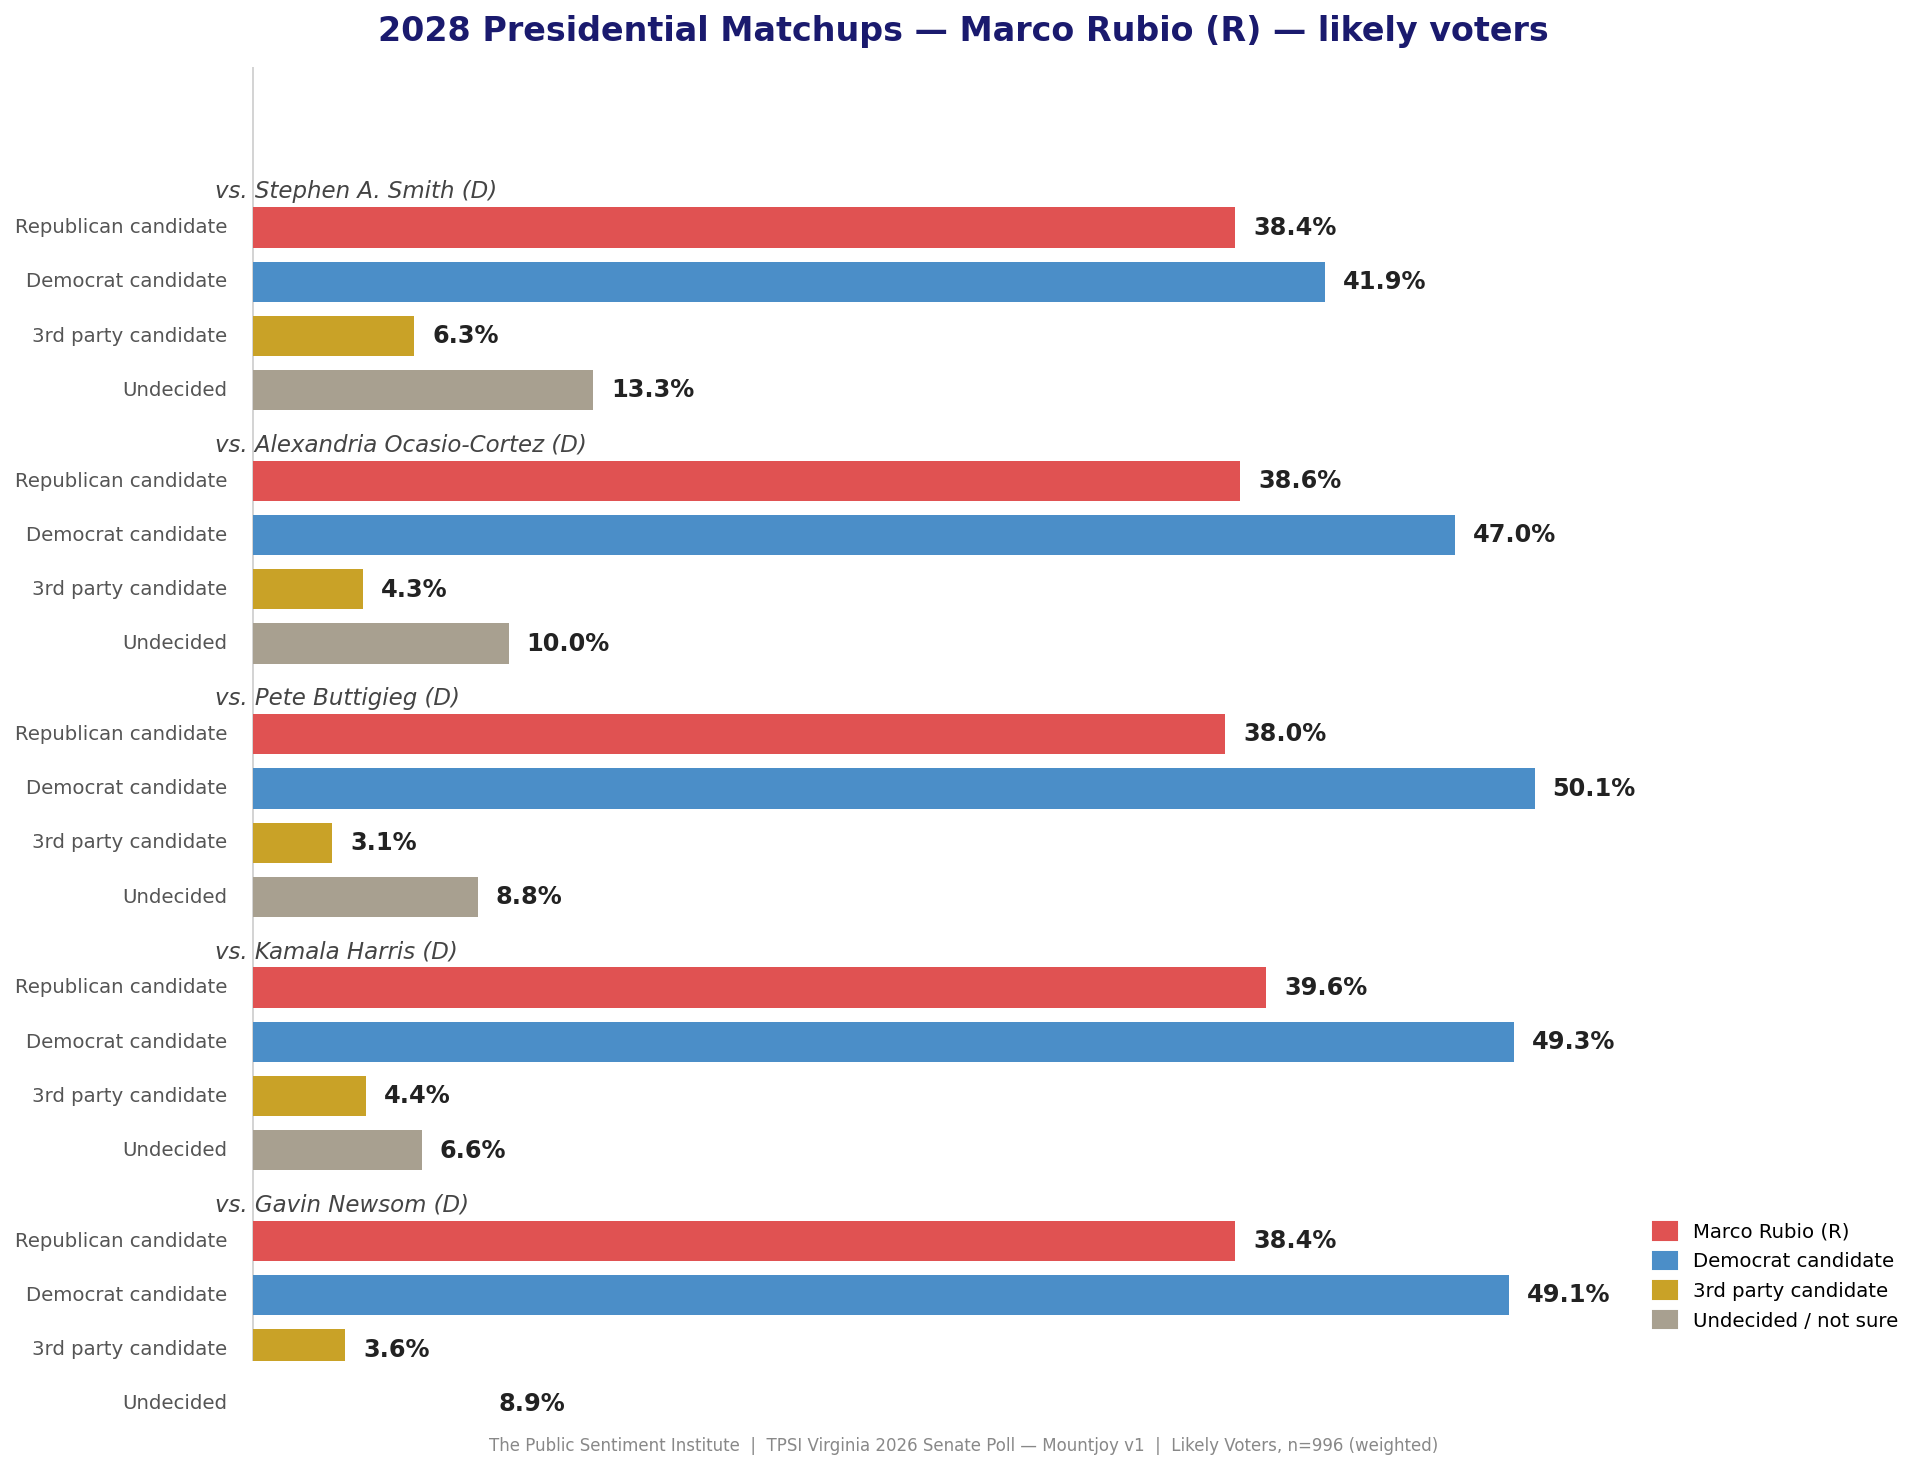
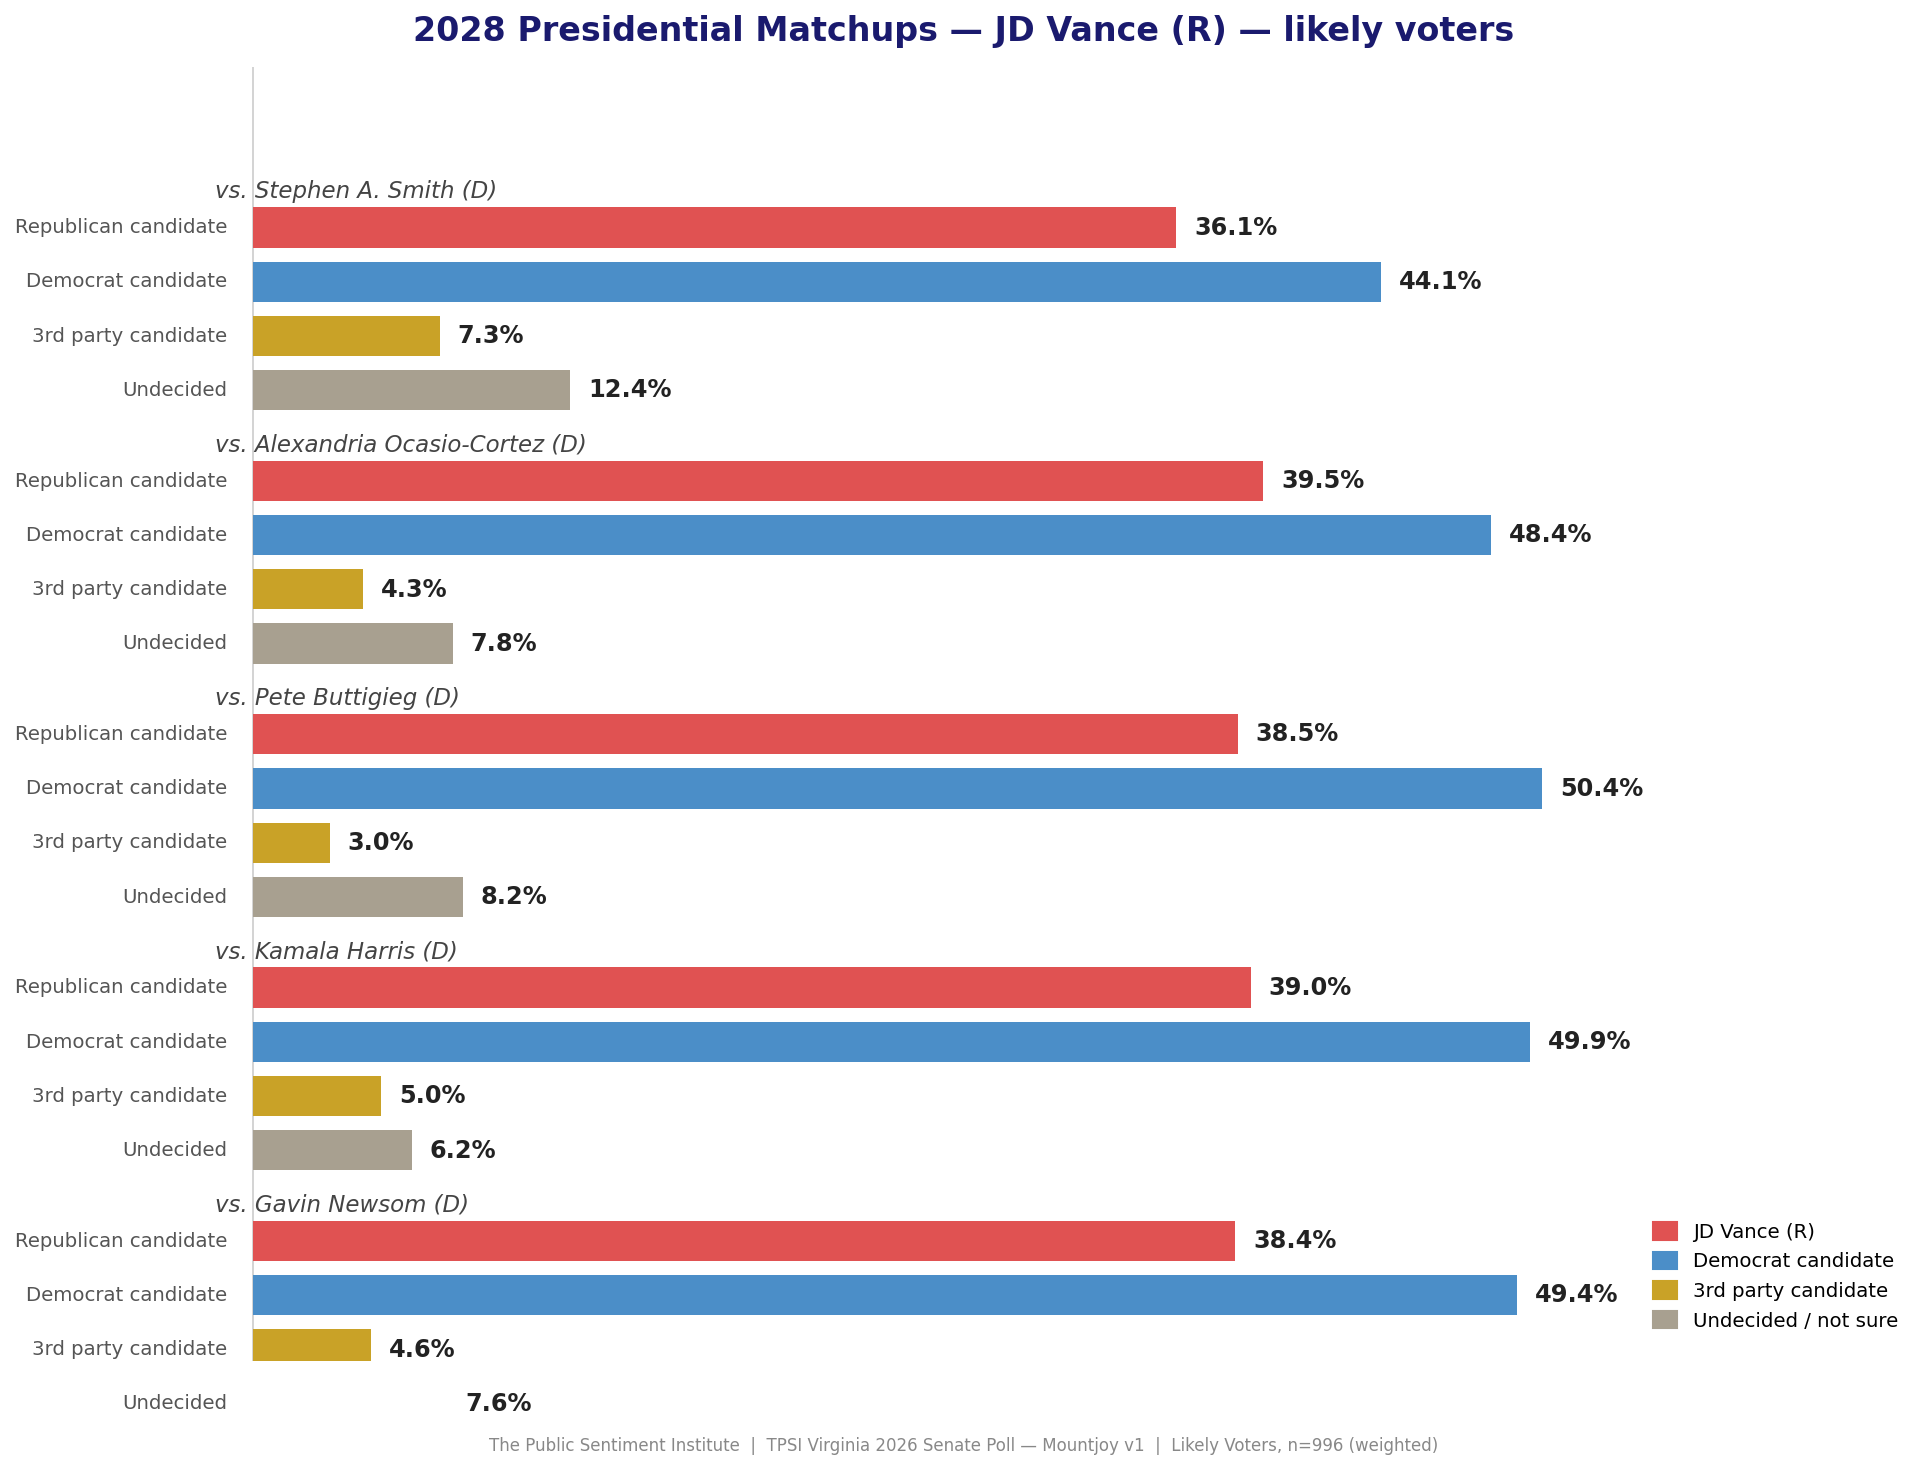
18. 2028 Presidential Matchups
Bottom Line
The fundamentals are unchanged: Virginia is a structurally Democratic state with a blue-leaning likely voter universe, a deeply unpopular president, and a Republican Senate field that hasn’t consolidated. The new data shows Trump’s disapproval hardening, Spanberger holding positive but softening at the intensity level, the primary reshuffled but unresolved, and economic distress affecting more than half the electorate.
The August 4th primary remains the next inflection point. Watch the Republican nominee’s name recognition trajectory — and whether the economic strain numbers translate into anti-incumbent energy directed at Democrats or at the current administration.
Survey conducted by The Public Sentiment Institute. n=996 likely voters (weighted). Margin of error ±3.7pp at 95% confidence. Fieldwork via Pollfish Random Device Engagement. Full crosstabs available at TPSI.